The Replenishment calculation performs a lot of steps to provide the suggested quantities in the Replen. Purchase Journal and Replen. Transfer Journal.
The system supports a logging functionality showing the used Replenishment Data, Inventory, Sales information, and which decision and formulas were used to calculate the suggested quantity. This can be useful for the user to understand the result of the calculation process.
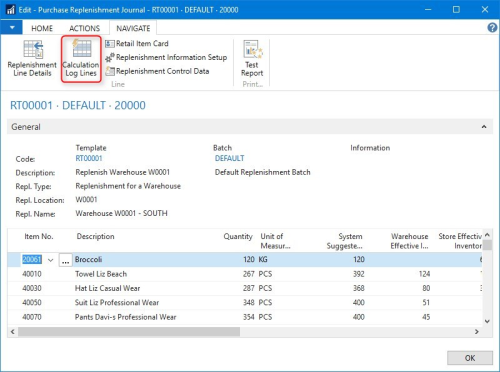
The Calculation Log Lines action is available on the Purchase Replenishment Journal page, the Navigate action menu:
You can activate the logging on the Replen. Setup page (Departments - LS Retail - Replenishment - Administration):
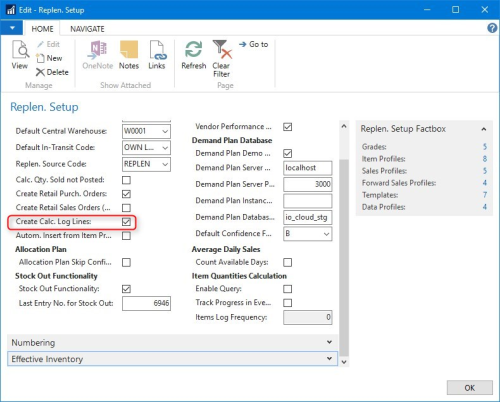
The logging functionality should only be used occasionally to investigate data and decisions in the replenishment quantity.
Example of Log Lines
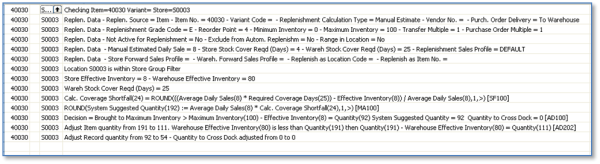
The above image shows the Replenishment Log for the item 40030 and store S0003.
Example:
|
Checking Item=40030 Variant= Store=S0003
|
Identifies the Item No., Variant Code and Store
|
Replen. Data - Replen. Source = Item - Item No. = 40030 - Variant Code = - Replenishment Calculation Type = Manual Estimate - Vendor No. = - Purch. Order Delivery = To Warehouse |
|
Replen. Data - Replenishment Grade Code = E - Reorder Point = 4 – Minimum Inventory = 0 – Maximum Inventory = 100 - Transfer Multiple = 1 – Purchase Order Multiple = 1 |
|
Replen. Data - Not Active for Replenishment = No - Exclude from Autom. Replenishm = No - Range in Location = No |
|
Replen. Data - Manual Estimated Daily Sale = 8 - Store Stock Cover Reqd (Days) = 4 - Wareh Stock Cover Reqd (Days) = 25 - Replenishment Sales Profile = DEFAULT |
|
Replen. Data - Store Forward Sales Profile = - Wareh. Forward Sales Profile = - Replenish as Location Code = - Replenish as Item No. = |
The lines starting with the text Replen. Data are the result of the Replenishment Data search.The text Replen. Source = informs about the Replenishment Data source (Item Store, Item or Data Profile record). This example is from the item record. If the Replen. Source were of type Data Profile, the next line will be to inform which Data Profile record is being used.
|
Store Effective Inventory = 8 - Warehouse Effective Inventory = 80 |
|
Wareh Stock Cover Reqd (Days) = 25 |
|
Calc. Coverage Shortfall(24) = ROUND(((Average Daily Sales(8) * Required Coverage Days(25)) - Effective Inventory(8)) / Average Daily Sales(8),1,>) [SF100] |
The calculation formula and values to calculate the Coverage Shortfall. You plan to sell 8 pieces per day for a coverage period of 25 days. You have 8 pcs in the store, so you lack 192 pieces which is a Coverage Shortfall of 24.
|
ROUND(System Suggested Quantity(192) := Average Daily Sales(8) * Calc. Coverage Shortfall(24),1,>) [MA100] |
The calculation formula and values to calculate the System Suggested Quantity. This is the quantity you need in the store to be able to sell for the next 25 days, given a forecast of 200 and having 8 pieces in stock.
|
Decision = Brought to Maximum Inventory > Maximum Inventory(100) – Effective Inventory(8) = Quantity(92) System Suggested Quantity = 92 Quantity to Cross Dock = 0 [AD100] |
The system brings the System Suggested Quantity to the Maximum Inventory value minus the Effective Inventory
|
Adjust Item quantity from 191 to 111. Warehouse Effective Inventory(80) is less than Quantity(191) then Quantity(191) - Warehouse Effective Inventory(80) = Quantity(111) [AD202] |
The Purchase Replenishment Journal is to re-stock the warehouse. The System Suggested Quantity is 191 and the Effective Inventory for the warehouse is 80 and therefore the system will replenish the difference of the two numbers or 111.
|
Adjust Record quantity from 92 to 54 - Quantity to Cross Dock adjusted from 0 to 0 |
The system then adjusts the record for item=40030 and store=S0003. The record has 92 of 191 (92/191) = 0,481 and therefore it will be 111 *0,481 = 54.
The quantity in the record has then been adjusted according to proportionally from the older quantity.