In this article
How Forecast Entries are used in Replenishment Calculation
To import and export Forecast Entries
You can view the calculated and downloaded forecast entries on the LS Forecast Entries page.
To view Forecast entries
- Click the
 icon, enter LS Forecast Entries, and select the relevant link.
 - Alternatively, click the
 icon, enter LS Forecast Setup, and select the relevant link. In the LS Forecast Setup page, click Forecast- LS Forecast Entries to open the desired page.
Below are the fields in the LS Forecast Entries page:
| Field | Description |
|---|---|
| Item No. | This field shows the number of the item. |
| Variant Code | This field shows the variant code of the item. |
| Location Code | This field shows the replenishment location for the item. |
| Date | This field shows the forecast date of the entry. |
| Forecast Quantity | This field shows the forecast quantity of the entry. |
| Forecast Quantity (Lower) | This field shows the lower fence or the "lower limit" of the forecast quantity. |
| Forecast Quantity (Upper) | This field shows the upper fence or the "upper limit" of the forecast quantity. |
| Downloaded Forecast Qty. | This field shows the forecast quantity of the entry downloaded from Forecast. For the entry marked as Calculated Forecast Entry, this indicates that the shown value is a pre-breakdown forecast quantity for the weekly or variant group calculation. |
| Downloaded Forecast Qty. (Lower) | This field shows the lower fence or the "lower limit" of the forecast quantity downloaded from Forecast. For the entry marked as Calculated Forecast Entry, this indicates that the shown value is a pre-breakdown forecast quantity for the weekly, monthly, or variant group calculation. |
| Downloaded Forecast Qty. (Upper) | This field shows the upper fence or the "upper limit" of the forecast quantity downloaded from Forecast. For the entry marked as Calculated Forecast Entry, this indicates that the shown value is a pre-breakdown forecast quantity for the weekly, monthly, or variant group calculation. |
| Forecast Quality % | This field shows the estimated accuracy of the forecast in percentage. |
| Location - Add. Dim. 1 Code | This field specifies the first location-specific dimension. |
| Loc. - Add. Dim. 1 Lift Value | This field specifies the calculated lift value of the first location-specific dimension. |
| Location - Add. Dim. 2 Code | This field specifies the second location-specific dimension. |
| Loc. - Add. Dim. 2 Lift Value | This field specifies the calculated lift value of the second location-specific dimension. |
| Location - Add. Dim. 3 Code | This field specifies the third location-specific dimension. |
| Loc. - Add. Dim. 3 Lift Value | This field specifies the calculated lift value of the third location-specific dimension. |
| Location - Add. Dim. 4 Code | This field specifies the fourth location-specific dimension. |
| Loc. - Add. Dim. 4 Lift Value | This field specifies the calculated lift value of the fourth location-specific dimension. |
| Location - Add. Dim. 5 Code | This field specifies the fifth location-specific dimension. |
| Loc. - Add. Dim. 5 Lift Value | This field specifies the calculated lift value of the fifth location-specific dimension. |
| Item - Add. Dim. 1 Code | This field specifies the first item-specific dimension. |
| Item - Add. Dim. 1 Lift Value | This field specifies the calculated lift value of the first item-specific dimension. |
| Item - Add. Dim. 2 Code | This field specifies the second item-specific dimension. |
| Item - Add. Dim. 2 Lift Value | This field specifies the calculated lift value of the second item-specific dimension. |
How Forecast Entries are used in Replenishment Calculation
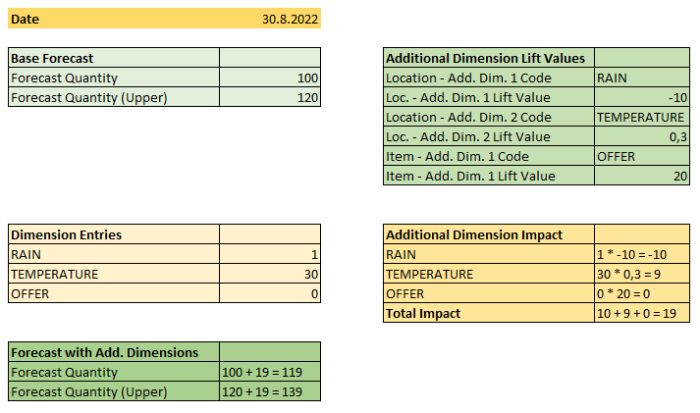
The LS Forecast Entries are used for replenishment calculation for all items having an LS Forecast calculation type. During the calculation, fields Forecast Quantity and Forecast Quantity (Upper) are taken into consideration. If there are relevant Additional Dimensions, they will also be taken into account.
The impact of each dimension is measured as the multiplication of the lift value and the dimension entry's value on a given date. The total impact of all dimensions is summed up and added to the base values in Forecast Quantity and Forecast Quantity (Upper). The below figure shows an example of how the forecast quantity with lift values is calculated.

Tip: To effectively visualize the forecast results, you can use the Replen. Sales Chart. For more information see Replenishment Sales Chart.
To delete Forecast Entries
The LS Forecast Entries can be deleted periodically by setting up the Scheduler Job DELETELOGS and the Days Forecast Entries Exist field in LS Forecast Setup.
- Click the
 icon, enter LS Forecast Setup, and select the relevant link.
 - In the General FastTab, fill in the Days Forecast Entries Exist field. This field specifies how far back in days to keep the LS Forecast Entries. All entries older than the defined period will be deleted if you enable the Scheduler job DELETELOGS.
To import and export Forecast Entries
You can import and export the data in table Forecast Entry via the following methods:
- Use the Import from Excel and Export to Excel actions on the LS Forecast Entries page.
- Publish page 10012337 LSCForecastEntriesWS on the Web Services page. Then consume the published web service to add, modify, and delete entries.
- Integrate directly with the API page 10012338 LSC Forecast Entries API. With this approach you are able to insert, modify, and delete multiple entries in one batch request.
See also