In this article
The Action Hub comes with an Alert History Chart and a Notification History Chart, which provide a graphical overview of the alerts and notifications raised within a defined period. Note: Only the alerts and notifications from the KPIs which you have access to, as defined in the Actionable Insights User Group KPI Links, are included in the charts.
Alert History Chart
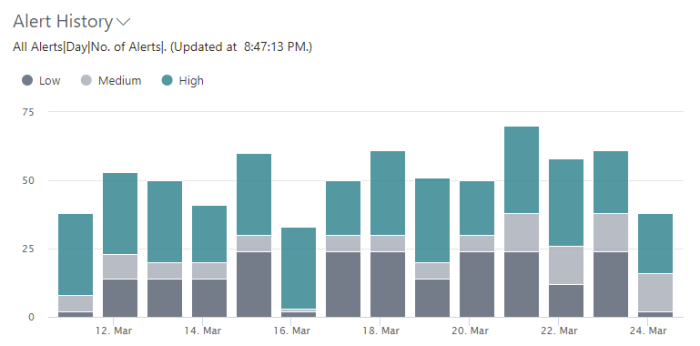
The Alert History Chart shows information about alerts raised within a defined period, grouped by severity. You can show the chart based on the number of alerts or by total Impact Scores.
There are various actions available in the chart to help you visualize the information (click the drop-down arrow):
| Action | Description |
|---|---|
| Show |
This action defines if all alerts or only alerts with notifications having specific statuses should be included in the chart. There are three options:
|
| Period Length | This action defines how the alerts should be grouped according to period. The options are Day, Week, Month, Quarter, and Year. The date on the chart will be based on either the work date or today's date, depending on the Use Work Date as Base field in the Actionable Insights User Setup page. |
| Value to Calculate |
This action selects the value to be displayed in the chart. There are two options:
|
| Chart Type | This action selects the chart's layout. The options are Stacked Area, Stacked Area (%), Stacked Column, and Stacked Column (%). |
Additionally, the alerts displayed in the chart can be further refined for the current user:
- In the Action Hub, click the User Setup - My Chart Settings action to open the user's Actionable Insights User Setup page.
Alternatively, you can click the User Setup - Retail Users action to open the Retail Users page where you select the user to be configured. Then click the Actionable Insights User Setup action.
In the Actionable Insights User Setup page, in the Role Center Chart Setup FastTab, you can configure the below fields that are related to the Alert History Chart:
| Field | Description |
|---|---|
| Use Work Date as Base | This field specifies if the chart will be based on the work date instead of today's date. |
| KPI Family Filter, KPI Group Filter, KPI Filter |
These fields specify the KPI Families, KPI Groups, and KPIs filters that can be applied on the Alert History Chart. These fields reside in the Alert History group.
Note: You can only select the KPI Families, KPI Groups or KPIs that you have access to, as defined in the Actionable Insights User Group KPI Links. |
Note: It is possible to set up a default value for the above chart filters on an Actionable Insights User Group, and new users that are added to the group will automatically inherit the settings. To apply the default filters:
- Go to the Actionable Insights User Groups page.
- Select and edit the user group of your choice to bring up the Actionable Insights User Group Setup page.
See How to: Set Up Actionable Insights Users and Groups for more information on how you can access the Actionable Insights User Groups page.
The following is an example of an Alert History Chart, showing the number of alerts raised per day, grouped according to severity:

You can click the data points of the chart to open the Actionable Insights Alerts page showing the relevant alerts in range.
Notification History Chart
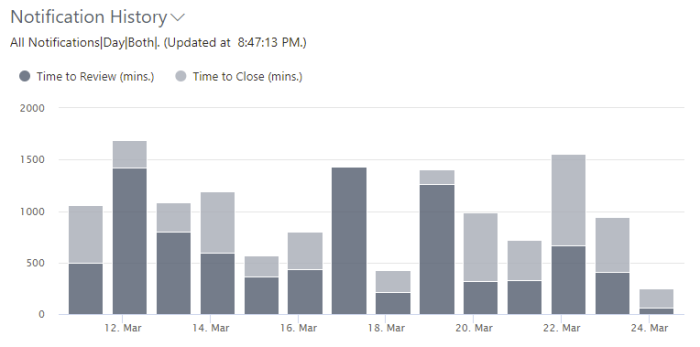
The Notification History Chart shows information about the notifications raised within a defined period. It gives an overview of the notifications and how long it took to review and close them. The chart helps you understand the responsiveness of the responsible teams and employees.
There are various actions available in the chart to help you visualize the information:
| Action | Description |
|---|---|
| Show |
This action defines if all notifications or only notifications having specific statuses should be included in the chart. There are three options:
|
| Period Length | This action defines how the notifications should be grouped according to period. The options are Day, Week, Month, Quarter, and Year. The date on the chart will be based on either the work date or today's date, depending on the Use Work Date as Base field in the Actionable Insights User Setup page. |
| Value to Calculate |
This action selects the value to be displayed in the chart. There are three options:
|
| Chart Type | This action selects the chart's layout. The options are Stacked Area, Stacked Area (%), Stacked Column, and Stacked Column (%). |
Additionally, the notifications displayed in the chart can be further refined for the current user:
- In the Action Hub, click the User Setup - My Chart Settings action to open the user's Actionable Insights User Setup page.
Alternatively, you can click the User Setup - Retail Users action to open the Retail Users page where you select the user to be configured. Then click the Actionable Insights User Setup action.
In the Actionable Insights User Setup page, in the Role Center Chart Setup FastTab, you can configure the below fields that are related to the Notification History Chart:
| Field | Description |
|---|---|
| Use Work Date as Base | This field specifies if the chart will be based on the work date instead of today's date. |
| KPI Family Filter, KPI Group Filter, KPI Filter |
These fields specify the KPI Families, KPI Groups, and KPIs filters that can be applied on the Notification History Chart. These fields reside in the Notification History group.
Note: You can only select the KPI Families, KPI Groups or KPIs that you have access to, as defined in the Actionable Insights User Group KPI Links. |
Note: It is possible to set up a default value for the above chart filters on an Actionable Insights User Group, and new users that are added to the group will automatically inherit the settings. To apply the default filters:
- Go to the Actionable Insights User Groups page.
- Select and edit the user group of your choice to bring up the Actionable Insights User Group Setup page.
See How to: Set Up Actionable Insights Users and Groups for more information on how you can access the Actionable Insights User Groups page.
The following is an example of a Notification History Chart, showing the average time taken in minutes to review and close the notifications on each day:

Tip: You can click the data points of the chart to open the My Actionable Insights Notifications page showing the relevant notifications in range.
See also