The rating phase is the second step of the Item Suggestion functionality. In this step, the program calculates the values of various metrics and ratings. You can assign different weights on the metrics to indicate how important it is for the business. Based on the chosen metrics and their weights, the tool derives a so-called Score Threshold.
An item can receive either Low, Medium, or High rating for a particular metric. The ratings are converted to points and then weighted scores. The final output is the Total Score for each item. Items having Total Score equal to or above the Score Threshold are considered as good candidates for LS Forecast.
The available metrics are:
Daily Sales Metrics
| Field | Description |
|---|---|
| Average Daily Sales |
The average daily sales of an item during the observation periods. This metric measures the daily sales volume. The rating of this metric is calculated based on Low-Medium-High analysis. |
| Daily Sales Frequency % | The Daily Sales Frequency measured in % of an item during the observation periods. This metric measures the proportion of days with sales. The rating of this metric is calculated based on Low-Medium-High analysis. |
| Daily Sales Standard Deviation | The Daily Sales Standard Deviation of an item during the observation periods. This metric indicates how volatile the daily sales data are. The lower value indicates more stability. The rating of this metric is calculated based on Low-Medium-High analysis. The levels are in a reversed order. |
Weekly Sales Metrics
| Field | Description |
|---|---|
| Average Weekly Sales | The Average Weekly Sales of an item during the observation periods. This metric measures the weekly sales volume. The rating of this metric is calculated based on Low-Medium-High analysis. |
| Weekly Sales Frequency % | The Weekly Sales Frequency measured in % of an item during the observation periods. This metric measures the proportion of weeks with sales. The rating of this metric is calculated based on Low-Medium-High analysis. |
| Weekly Sales Standard Deviation | The Weekly Sales Standard Deviation of an item during the observation periods. This metric indicates how volatile the weekly sales data are. The lower value indicates more stability. The rating of this metric is calculated based on Low-Medium-High analysis. The levels are in a reversed order. |
Monthly Sales Metrics
| Field | Description |
|---|---|
| Average Monthly Sales | The Average Monthly Sales of an item during the observation periods. This metric measures the monthly sales volume. The rating of this metric is calculated based on Low-Medium-High analysis. |
| Monthly Sales Frequency % | The Monthly Sales Frequency measured in % of an item during the observation periods. This metric measures the proportion of months with sales. The rating of this metric is calculated based on Low-Medium-High analysis. |
| Monthly Sales Standard Deviation | The Monthly Sales Standard Deviation of an item during the observation periods. This metric indicates how volatile the monthly sales data are. The lower value indicates more stability. The rating of this metric is calculated based on Low-Medium-High analysis. The levels are in a reversed order. |
Other Metrics
| Field | Description |
|---|---|
| Out-of-stock | The indicator if an item is currently out-of-stock. Out-of-stock items get three points and items that are in stock get one point. |
| ABC Sales | The ABC Sales category of an item. A is translated to Low, B to Medium, and C to High rating level. |
| ABC Profit | The ABC Profit category of an item. A is translated to Low, B to Medium, and C to High rating level. |
| Unit Price | The current unit price of an item. The rating of this metric is calculated based on Low-Medium-High analysis. |
Sales statistics
The daily sales statistics are collected for a certain number of days in the past, which is defined by the field Sales History - Days in the Item Selection Template.
The weekly sales statistics are collected for a certain number of weeks in the past, which is defined by the field Sales History - Weeks in the Item Selection Template.
The monthly sales statistics are collected for a certain number of months in the past, which is defined by the field Sales History - Months in the Item Selection Template.
When calculating the sales statistics, a period that is prior to the very first sales of an item will not be taken into account. An out-of-stock period will also be skipped.
Ratings calculation
LS Forecast uses Low, Medium, and High analysis to determine the ratings for the sales-related metrics and the unit price metric. For each metric, the tool looks at the values of all items within the data set and finds the distance between the maximum and the minimum value. This distance is divided into three ranges, Low, Medium, and High, based on the percentages defined by fields Low level Limit %, Medium Level Limit %, and High Level Limit % in the Item Rating Setup. An item having a value within the Low range will be rated as Low for this particular metric. The same logic is applied for Medium and High.
This analysis depends on the size of the data set. The larger the data set, the better the result will be. Therefore, you should have at least 100 items in the data set. The ratings are converted to points: Low corresponds to one point, Medium to two points, and High to three points. The only exception is the Out-of-stock metric, where out-of-stock items get three points and items that are in stock get one point.
Another exception is the Standard Deviation metric. The rating of a Standard Deviation metric is done in a reversed manner. The lower the Standard Deviation's value, the higher rating and more points the item will receive.
Weighted scores
For each metric, a so-called weighted score is derived for all items in the data set. It is the multiplication of the points coming from the rating and the weight coming from the Item Rating Setup. You can apply different weights to the metrics. The weight can vary from 0 to 3. You deactivate a metric by setting its weight to 0.
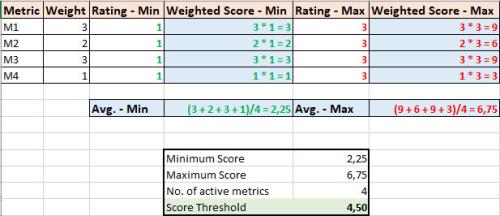
Based on the weights you configured in Item Rating Setup, the tool calculates a so-called Score Threshold. It is the number that is half way between the minimum possible score and the maximum possible score.
The below table shows an example of how the Score Threshold is calculated when four metrics are activated.

Total Score and Total Rating
The final output is the Total Score for each item, which is the average of all weighted scores of all activated metrics. Items having the Total Score equal to or above the Score Threshold are rated as good candidates for LS Forecast. The Total Rating of an item can be either Good or Bad. You can use this as a guideline to chose the suitable LS Forecast items.
Item Suggestion Worksheet
The Item Suggestion Worksheet is the main working page where you can run the LSC Forecast Item Selection report. This report first runs the selection process, followed by the ratings calculation process. On the worksheet, there are other actions that you might find useful as well:
| Action | Description |
|---|---|
| Recalculate Scores | This action recalculates the weighted scores, Total Score and Total Rating, for all items in the worksheet. You would typically run this action after changing the weights in the Item Rating Setup |
| Show/Hide Detailed Scores | This action shows and hides detailed scores and rating columns. |
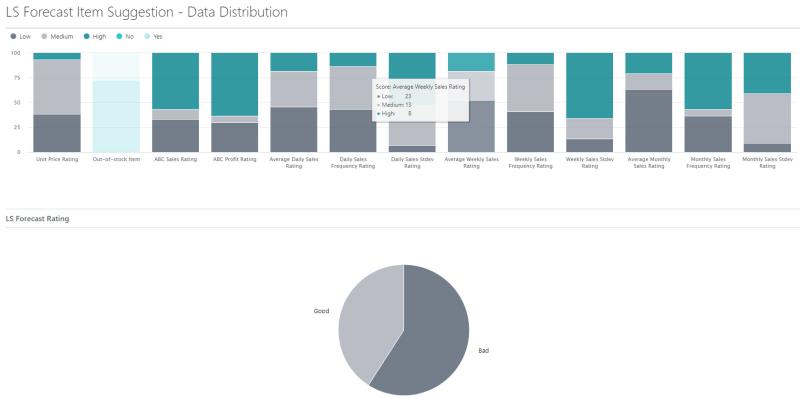
| View Data Distribution Chart | This action displays the Data Distribution Charts. The Metrics Rating Distribution chart shows the rating distribution for each metric and the LS Forecast Rating chart shows how many items are classified as good and bad candidates for LS Forecast. |
The following is an example of the Metrics Rating Distribution Chart, showing the number of items in each rating group for each metric. The pie chart shows the number of items which have been identified as good candidates for LS Forecast as well as the bad candidates.

See also